I wrote recently about Mr Couling's surprising remarks to a committee of the Scottish Parliament that sanctioned claimants welcomed the jolt. Since then a number of FOI requests asking for evidence have been made, see here and here. Unfortunately, most of these have fallen foul of the £600 limit despite geographically limiting their request although this one faired a little better.
I have submitted a slightly different request simply asking for the evidence relied on by Mr Couling in making his surprising remarks. Like some of my previous requests, this allows the DWP to simply ask Mr Couling for the evidence and send it to me. It shouldn't be too expensive.
29 May 2014
13 May 2014
Unbelievable
From time to time, DWP spokesmen say things that I and others find
difficult to swallow. This post is about two such items and efforts to
"fact check" such utterances.
1. Universal Jobmatch.is a jobs website run for the DWP by Monster Inc.It's received quite lot of adverse criticism because of the "bogus jobs" advertised on it and the suspicion that it's more about policing claimants job searching that actually helping them find work.
Then I saw a letter from Neil Couling (Head of Jobcentre Plus, DWP) and Sal Iannuzzi (CEO, Monster) saying:
2. The other surprising utterance (again by Mr Couling) was to the Scottish Welfare Reform Committee on Tuesday 29th April 2014
There have been several FOI requests asking for evidence, see here and here
1. Universal Jobmatch.is a jobs website run for the DWP by Monster Inc.It's received quite lot of adverse criticism because of the "bogus jobs" advertised on it and the suspicion that it's more about policing claimants job searching that actually helping them find work.
Then I saw a letter from Neil Couling (Head of Jobcentre Plus, DWP) and Sal Iannuzzi (CEO, Monster) saying:
With millions of active jobseekers over the last year, those best placed to judge the system, our users, tell us they like it and that it makes a real difference to how they look for work.This surprised me so I asked for full details of the evidence relied on for the assertion that users like Universal Jobmatch. You might have expected a multinational corporation and a large government department to have extensive information - survey results perhaps. You'd be wrong. The essence of their reply is here:
Jobseekers, who have been using Universal Jobmatch, have provided anecdotal informal feedback on the service to Advisers and Work Coaches at Jobcentre Plus offices across the country. This feedback indicates that jobseekers like Universal Jobmatch and that it makes a real difference to how they look for work.Remember, that's the full basis of the assertion.
2. The other surprising utterance (again by Mr Couling) was to the Scottish Welfare Reform Committee on Tuesday 29th April 2014
Neil Couling: ... My experience is that many benefit recipients welcome the joltThe full report of the meeting can be found here
that a sanction can give them.
The Deputy Convener: So, jobcentres across the country have been inundated with thank you cards from people who have received sanctions.
Neil Couling:Yes that is not so remarkable.
There have been several FOI requests asking for evidence, see here and here
11 May 2014
Analysis of a Million Sanction Decisions - Part 2
Those of you who read my previous post where I tried to link the propensity of JCP staff to refer claimants for a sanction may recall that I didn't have access to the individual Jobcentre case-load figures. I've now located Statistics on Jobseeker's Allowance by Jobcentre district and by month from March 2008 to October 2012 and used the October 2012 figure for the claimant count at each Jobcentre and hence calculated the rate of sanction referrals for most Jobcentres. (Remember, a "referral" is JCP staff "reporting" the claimant for sanction - an "adverse decision" from the Decision Maker" is by no means certain) I say "most" Jobcentres because some have been renamed, closed or opened between the two sets of data. If I couldn't match them up, I took them out. That's why your favourite Jobcentre might be missing. There are other limitations
Here's some analysis - feel free to download the data and do your own too.
1. To get an idea of the variation between Jobcentres, I did a scatter plot

This shows that highest sanction referral rates are found in some smaller Jobcentres. A few of the lowest rates are in this group too. Large Jobcentres are very middle of the road.
2. Suspecting something "unnatural" about this chart, I sorted by sanction referral rates and plotted a histogram
 Comments:
See below for some high/low rate officesHere's some analysis - feel free to download the data and do your own too.
1. To get an idea of the variation between Jobcentres, I did a scatter plot
This shows that highest sanction referral rates are found in some smaller Jobcentres. A few of the lowest rates are in this group too. Large Jobcentres are very middle of the road.
2. Suspecting something "unnatural" about this chart, I sorted by sanction referral rates and plotted a histogram
- Slopes are pronounced at around 4% and 8%. This suggests that JCP is monitoring the statistics and paying closer attention to offices outside the 4-8% range. There might even be an internal understanding that 4-8% is OK
- The lack of any offices with less than 2.5% might be an indication of a mandatory target to exceed this figure
- Again, there are some high rate outliers.


Finally, for a different take on sanction geography, see Geographical Variations in JSA Sanctions and Disallowances by Dr David Webster. This has some interesting work on the correlation between sanctions and local unemployment rate. It's also where I found the link to claimant count data :-)
5 May 2014
Analysis of a Million Sanction Decisions
I was interested to find out if individual Jobcentres varied in their sanction rates. This is not as simple as it might seem. Front line staff don't make these decisions, they refer a "doubt" to a "Decision Maker" who may be based elsewhere.
The decision might be to impose the sanction or reject it. (They can also "cancel" it but that's more technical). However, I decided to to stick with the number of decisions (regardless of what the decisions actually were) as a measure of the propensity of front line staff to "report" claimants.
So I downloaded the data from the DWP StatExplore" tool and to further simplify things, focussed on decisions under the "new" regime from 22nd Oct 2012. There's a load of Jobcentres with zero decisions - mainly because they're closed so I took them out. I sorted the data to show the "top" offices at the top.You can download my extract of over a million sanction decisions here but for those with less time, some headlines:
Some of the variation is understandable. In particular, some of those places and presumably their case-load is small. I've tried to find matching caseload statistics without success. Some data I noticed:
PS: See also a later post that resolves the caseload issue.
The decision might be to impose the sanction or reject it. (They can also "cancel" it but that's more technical). However, I decided to to stick with the number of decisions (regardless of what the decisions actually were) as a measure of the propensity of front line staff to "report" claimants.
So I downloaded the data from the DWP StatExplore" tool and to further simplify things, focussed on decisions under the "new" regime from 22nd Oct 2012. There's a load of Jobcentres with zero decisions - mainly because they're closed so I took them out. I sorted the data to show the "top" offices at the top.You can download my extract of over a million sanction decisions here but for those with less time, some headlines:
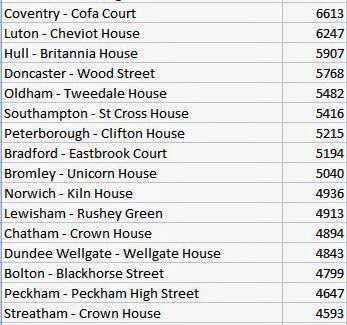 | |
| "Top" performers |
 | |
| Bottom of the league |
Some of the variation is understandable. In particular, some of those places and presumably their case-load is small. I've tried to find matching caseload statistics without success. Some data I noticed:
- Hull is well know for having a lot of unemployment and hence the caseload will be high. So being near the top of the table may not be so remarkable.
- Southampton with over 5000 looks high considering that according to the council they only have 4,187 unemployed.
- Norwich has almost 5000 decisions and Norfolk County Council's unemployment figures for the whole county say In the year to December 2012, 24,000 people of working age were unemployed in Norfolk.
PS: See also a later post that resolves the caseload issue.
Conflict at the Jobcentre
In an ideal world, Jobcentre advisers and claimants have constructive discussions about the best way to get work and new employment would be found. The "system" recognises that this doesn't always happen and provides a mechanism called a "Jobseekers Direction" to force claimants to do what the adviser wants on pain of having their benefits cut. The guidance has changed over time but the main thrust is that it's a way of dealing with pig-headed claimants who won't act in their own best interests. Those with a jaundiced view of Jobcentres would worry about the power this places in the hands of inadequate or even bullying staff.
I've stumbled on a hint of an evidence stream that Jobcentres could use to detect abuse of the system. - if they so wished. I noticed the answer to a Freedom of Information request and in particular some statistics about JSDs over short period in just one Jobcentnre. I've graphed them:

Now, it might be that there were some particularly recalcitrant claimants attending in early January 2013 who were quickly brought to heel so reducing JSD activity in subsequent weeks. Another possibility is that just one adviser was in a bad mood and had themselves a JSD-fest. Having worked in various customer-facing roles myself, the most likely explanation was that there was some sort of "initiative" in early January. Perhaps advisers were simply reminded that a JSD could be a useful tool? (I recall going on a safeguarding course at one job and suddenly we were seeing appropriate cases everywhere!)
I would hesitate to offer firm conclusions about t what was going on. There's too little data. I can't tell if a single member of staff went off the rails or if a larger team had some input. But Jobcentre managers should monitor similar figures as a possible way of checking how the relationships between their staff and claimants are going. Perhaps they already do - I hope so.
PS: Related to this, see Results of PCS membership Survey on Conditionality and Sanctions (Posted 1 May 2014) especially:
 Source
I've stumbled on a hint of an evidence stream that Jobcentres could use to detect abuse of the system. - if they so wished. I noticed the answer to a Freedom of Information request and in particular some statistics about JSDs over short period in just one Jobcentnre. I've graphed them:
Now, it might be that there were some particularly recalcitrant claimants attending in early January 2013 who were quickly brought to heel so reducing JSD activity in subsequent weeks. Another possibility is that just one adviser was in a bad mood and had themselves a JSD-fest. Having worked in various customer-facing roles myself, the most likely explanation was that there was some sort of "initiative" in early January. Perhaps advisers were simply reminded that a JSD could be a useful tool? (I recall going on a safeguarding course at one job and suddenly we were seeing appropriate cases everywhere!)
I would hesitate to offer firm conclusions about t what was going on. There's too little data. I can't tell if a single member of staff went off the rails or if a larger team had some input. But Jobcentre managers should monitor similar figures as a possible way of checking how the relationships between their staff and claimants are going. Perhaps they already do - I hope so.
PS: Related to this, see Results of PCS membership Survey on Conditionality and Sanctions (Posted 1 May 2014) especially:
Subscribe to:
Comments (Atom)