The decision might be to impose the sanction or reject it. (They can also "cancel" it but that's more technical). However, I decided to to stick with the number of decisions (regardless of what the decisions actually were) as a measure of the propensity of front line staff to "report" claimants.
So I downloaded the data from the DWP StatExplore" tool and to further simplify things, focussed on decisions under the "new" regime from 22nd Oct 2012. There's a load of Jobcentres with zero decisions - mainly because they're closed so I took them out. I sorted the data to show the "top" offices at the top.You can download my extract of over a million sanction decisions here but for those with less time, some headlines:
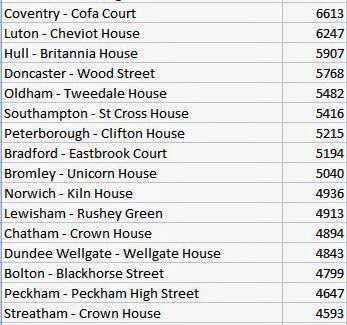 | |
| "Top" performers |
 | |
| Bottom of the league |
Some of the variation is understandable. In particular, some of those places and presumably their case-load is small. I've tried to find matching caseload statistics without success. Some data I noticed:
- Hull is well know for having a lot of unemployment and hence the caseload will be high. So being near the top of the table may not be so remarkable.
- Southampton with over 5000 looks high considering that according to the council they only have 4,187 unemployed.
- Norwich has almost 5000 decisions and Norfolk County Council's unemployment figures for the whole county say In the year to December 2012, 24,000 people of working age were unemployed in Norfolk.
PS: See also a later post that resolves the caseload issue.
1 comment:
Thanks, very interesting.
Now go for the caseloads.
SL :)
Post a Comment